I just got email form my manger (she is a bit blog enthusiast) that I have stopped writing blogs. The thing is at Kualitatem, we encourage our resources to learn and/or share their experiences. I played the usual busy card, but later on her persuasion, here I am.
This topic I have been having in my mind for more than 6 months. And I not so called ‘performance tester’ was not able to get the proper answer from anybody. Question was, “Is load runner able to give you the actual picture on its own”. Well simple answer is, “If you are a guru, then it gives you fair idea of the whole situation, but no, it’s not possible”. (To let you on a secret, my ego was hurt by couple of load runner projects, which made me sit up and take notice, before that I always thought load testing as alien for myself, a test management resource.)
I will try to explain below why only load runner is not enough for performance testing, below.
Load runner is a tool for performance monitoring. It is able to tell you, what is application’s behavior, at what time under how much load. But it will not be able to tell you what was the origin of the problem and was this problem even problem, or mare hardware configuration issues. (Even load runner itself says that it is able to only provide 10% of actual diagnostics information.)
After exploring more, and doing some experiments, I came to know load runner is not been able to tell me
- What was the condition of hardware before and after load test
- What was the area causing the problem
- What other application area are suffering due to this load
- Is there a way to improve (clue, people say that you only need to look at page load to understand performance of application, well my answer now is HELL NO!)
So we have identified the main problems, we need to find the solution for it.
My research led me to the solution, and believe you me, the solutions was always there, we (or Ancient Performance Testers) only chose to let us believe we only have Load Runner, so coming back to solution, it’s simple, we need to use more tools for Performance Testing together with different scopes in order to establish better results from performance testing, and HP is already providing them by name of HP Diagnostics and HP Site Scope.
Well Site scope is tool basically monitor the all aspects of IT infrastructure (in words of HP, “Remote monitoring of IT infrastructure and applications without installing any software on target systems”) while name of diagnostics clearly indicates its function, which is to deliver to you actual problem at any given point of time, and helps you in targeting them (in words of HP, “Remote monitoring of IT infrastructure and applications without installing any software on target systems”).
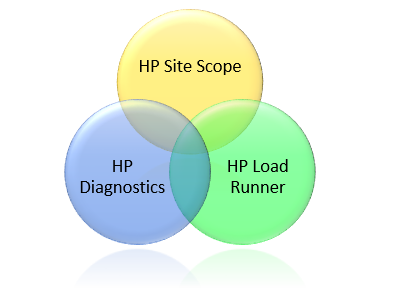
Now again the problem is to know at which point of time, what is right information. So consider following chart
- Site scope will give you information of hardware and software for 24/7, when script is being executed, before it and after it.
- Diagnostics will tell you what is the current state of application, which function is using how much resources, and what has left stones unturned
- Loadrunner will execute the scenario, and tell you what is the situation form user point of view during that scenario
So by combining the results from all three, we will be able to identify the situation before the issue was occurred, what occurred that issue, and from where we can resolve it.
In my next blogs, I will try to help you set up performance testing environment, as I believe is the correct way.
Topics are
- HP Diagnostics introduction
- Setting up Diagnostics Commander Server
- Setting up Diagnostics Mediator Server
- Setting up Diagnostics Java Probe with Tomcat
- Setting up Diagnostics Java Probe with JBOSS
- Setting up Diagnostics .NEt Probe
- HP Sitescope Introduction
- Setting up Sitescope monitors
- Configuration of HP Diagnostics and HP Site Scope with HP Load Runner

